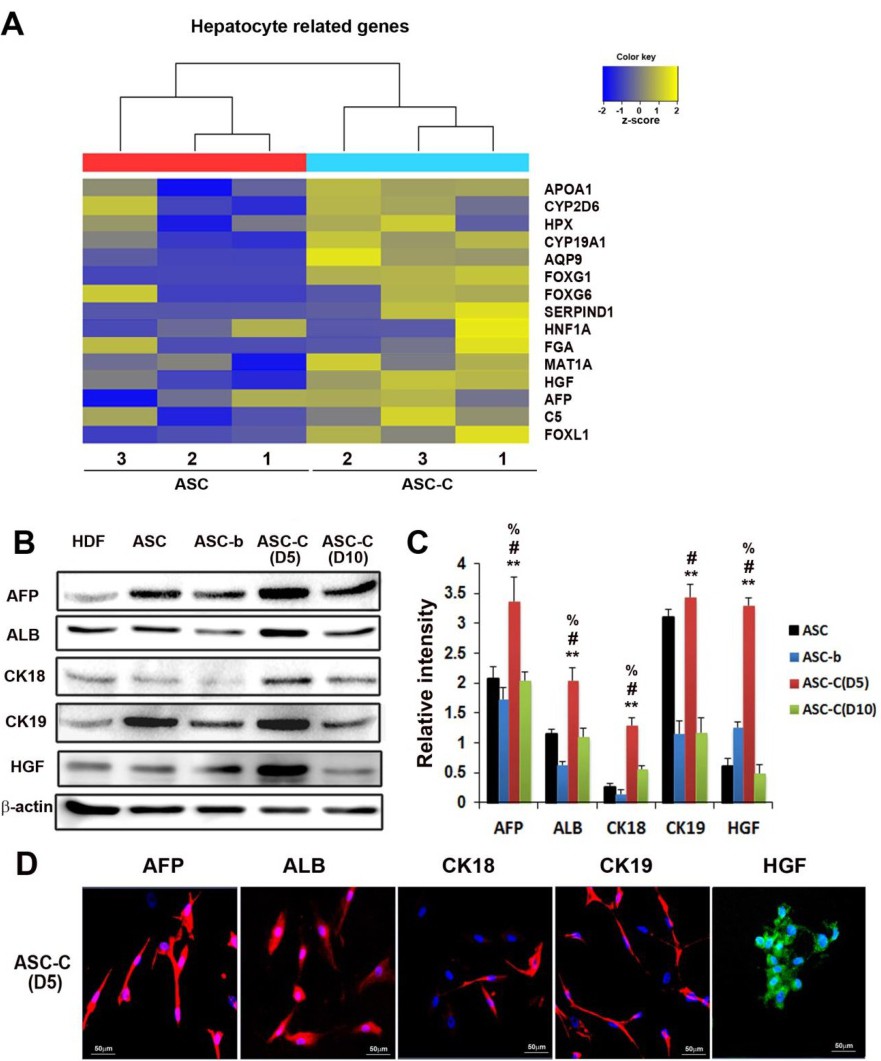
Fig. 4. Hepatocyte characteristics of ASC-C. (A) The results of hierarchical clustering analysis represented as a heat map of the expression level of 15 hepatocyte-related genes. (B) Western blot results of the expression of 5 representative hepatocyte-specific proteins. Protein levels of AFP, ALB and HGF correlated with the microarray data. (C) Quantitative analysis of western blot results. The individual values were normalized to α-actin. n = 4 per group. **p<0.01 vs. ASC-b; #p<0.01 vs. ASC-C (D-10); %p<0.01 vs. ASCs. (D) Immunocytochemistry results of ASC-C. DAPI=4',6-diamidino-2-phenylindole (Blue fluorescence).